Have you ever wondered what really happens across the network during an Nmap scan? In this tutorial, we’ll find out how to take a closer look into the thousands of packets that traverse the network during a default Nmap scan.
The Default Nmap Scan
This is a scan made from my Windows XP desktop (yes, Nmap works just fine in Windows!). In this example, we’re running a default Nmap scan to the host scanme.insecure.org.
C:\>nmap scanme.insecure.orgStarting Nmap 4.21ALPHA4 ( http://insecure.org ) at 2007-04-10 17:26 Eastern Daylight Time
Interesting ports on scanme.nmap.org (205.217.153.62):
Not shown: 1698 filtered ports
PORT STATE SERVICE
22/tcp open ssh
25/tcp closed smtp
53/tcp open domain
70/tcp closed gopher
80/tcp open http
113/tcp closed authNmap finished: 1 IP address (1 host up) scanned in 94.062 seconds
C:\>
This is a simple Nmap scan that uses every possible default option to scan the device named scanme.insecure.org. This is a real device that Fyodor hosts on his network for testing and development purposes.
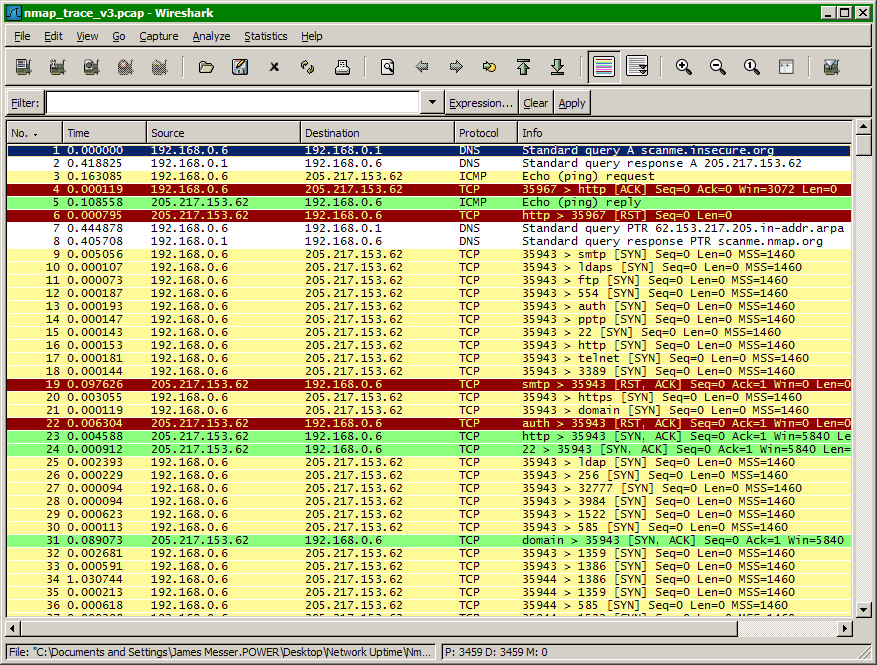
How does Nmap determine which ports will be open, closed, or filtered? To investigate this series of events, we’ll take advantage of an open-source protocol analyzer called Wireshark.
Since Wireshark and Nmap both use similar libraries to operate, you’ll find that running these programs simultaneously in both Windows and Linux operates flawlessly.
Built-In Packet Tracing
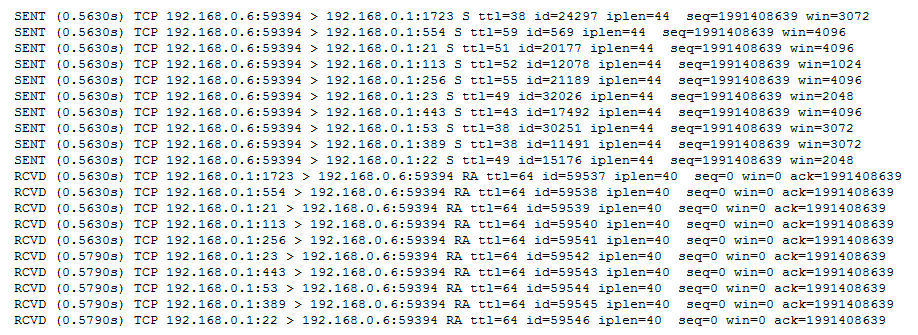
Nmap also includes a built-in packet tracing facility that is useful when running Nmap on the command line without the luxury of a graphical packet decoding engine. By simply adding the Nmap option –packet-trace anywhere in the command line, Nmap will create an additional line of output for every packet sent or received.
This is a small sample of the –packet-trace output:
Capturing and Displaying an Nmap Scan with Wireshark
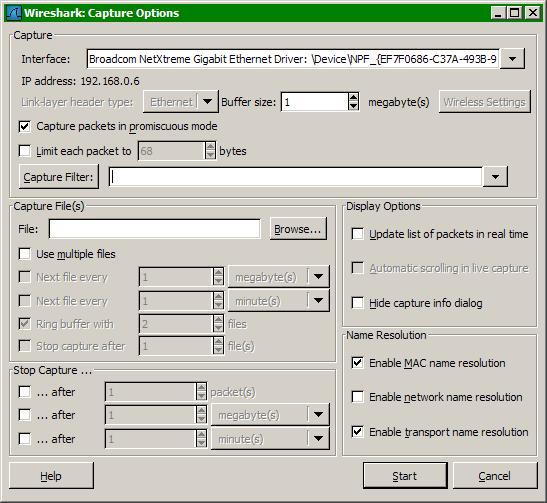
Wireshark provides extensive options for capturing and decoding any network traffic, including Nmap communications. To begin the capture process, start Wireshark, select the “Capture” pull-down menu, and choose “Options.”
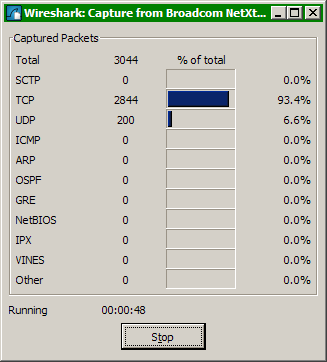
Selecting the “Start” button will launch the Wireshark capture status display. This display shows the types of frames captured during the session and provides percentage comparisons across packet types.